The application uses a custom hook to periodically update each plane's position. It calculates the new location based on the plane's speed and heading. This ensures that planes move smoothly across the map and accurately reflect real-world dynamics.
-
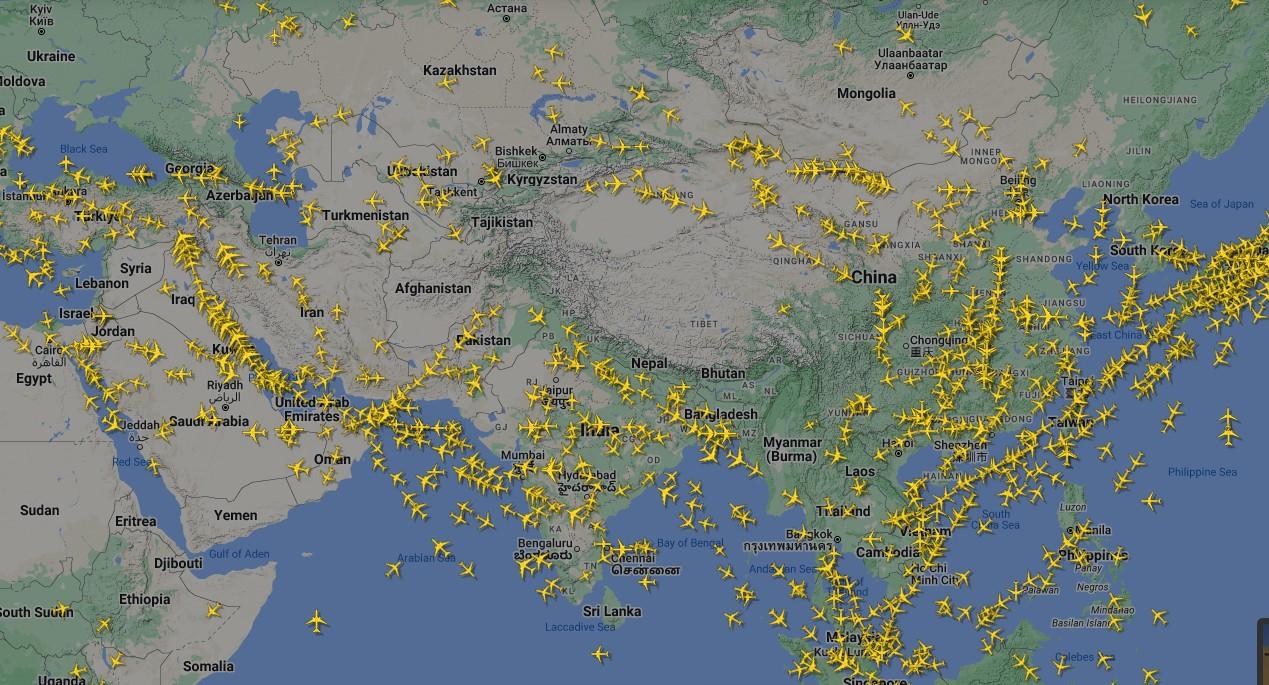
Build a dynamic flight tracker using React and Google Maps API
-
Integrate real-time flight data for live tracking
-
Create an interactive, user-friendly map interface